Fleet Management
To foster a vision of future for the activity of couriers in the Zé Delivery ecosystem, we received the objective to design a long-vision roadmap based on success metrics and impact on the company’s value proposition. Our challenge was to connect all the dots between the final product and to who would deliver it, considering all the touchpoints: onboarding, receiving an order, delivering and getting paid.
Diverging
Process
Understand the legacy
• Understand past activities
• Connect initiatives with objectives
• Relationship between Couriers and Sellers
• Opportunity solution tree
Define a method
• Bibliography selection
• Third party logistics x fourth part logistics (3PL x 4PL)
• Logistics Service Pyramid
• Pillars to achieve knowledge
Gather data
• Field research
• Stakeholders interview
• Quantitative researches
• Pillars to achieve knowledge
• Final analysis
Iterate on objectives
• Couriers main targets
• Seller main targets
• Quantitative researches
• Opportunity overview
• Problem statement
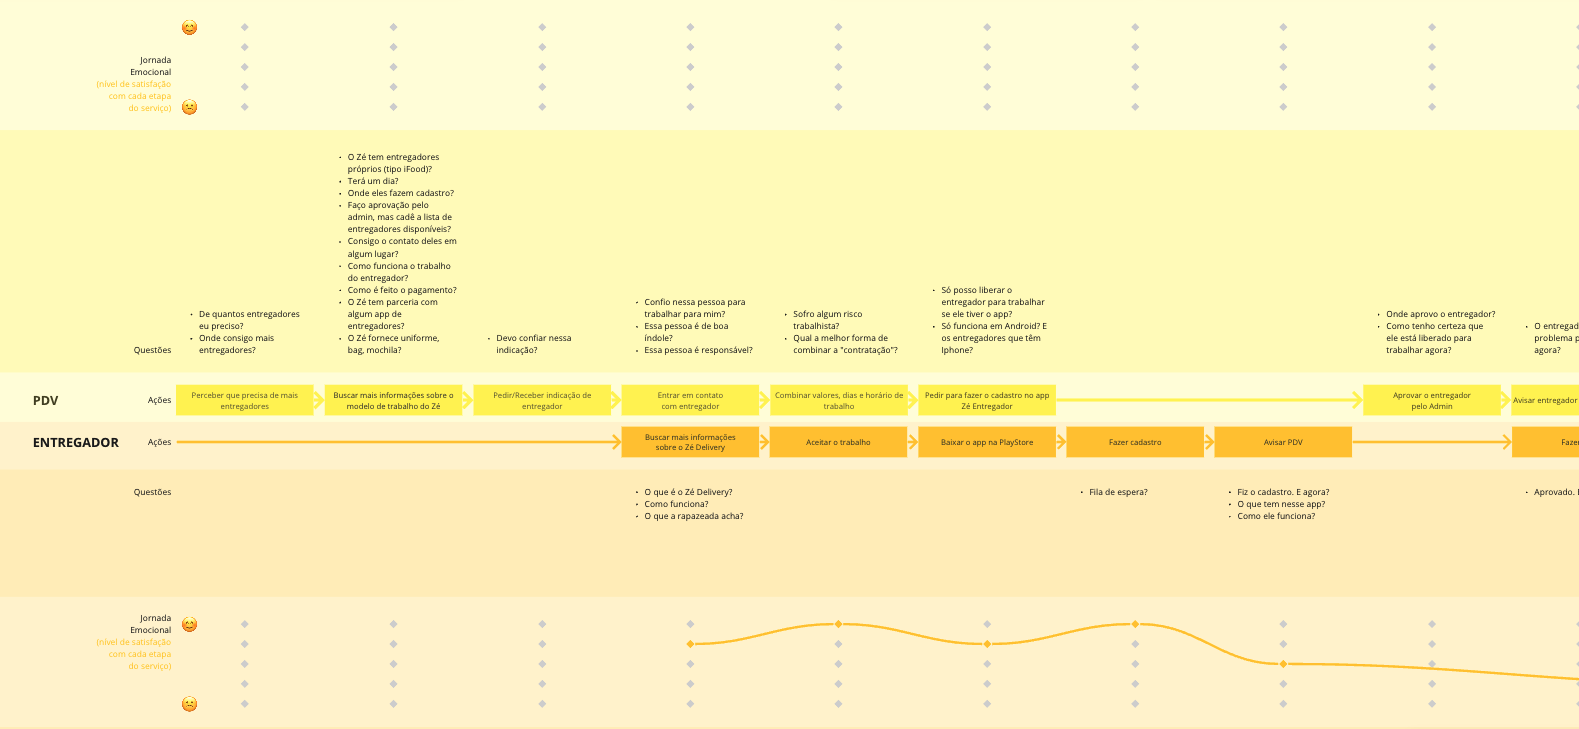
Modeling a service Blueprint considering the relationship between Couriers and Sellers
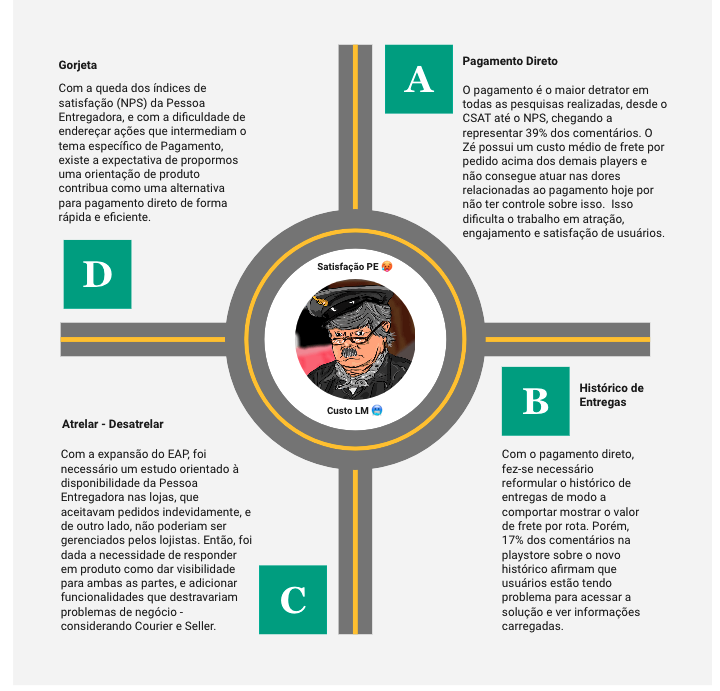
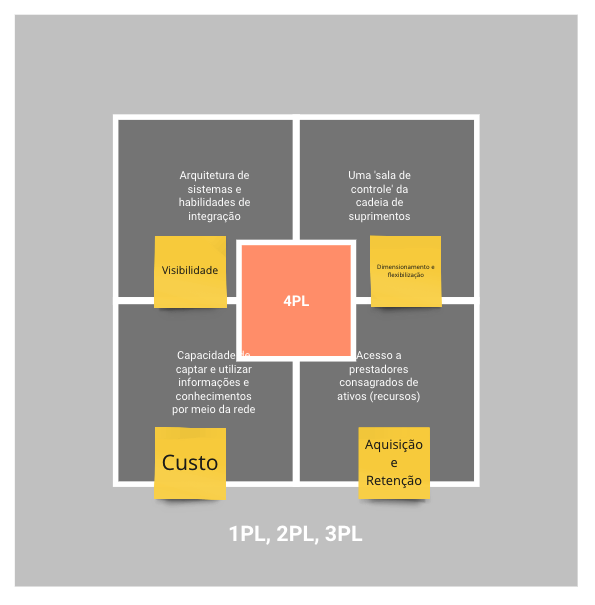
Initiatives overview x objectives, showing that we were walking in 'circles', and defining pillars of acting, based on Martin Christopher bibliography.
Field research
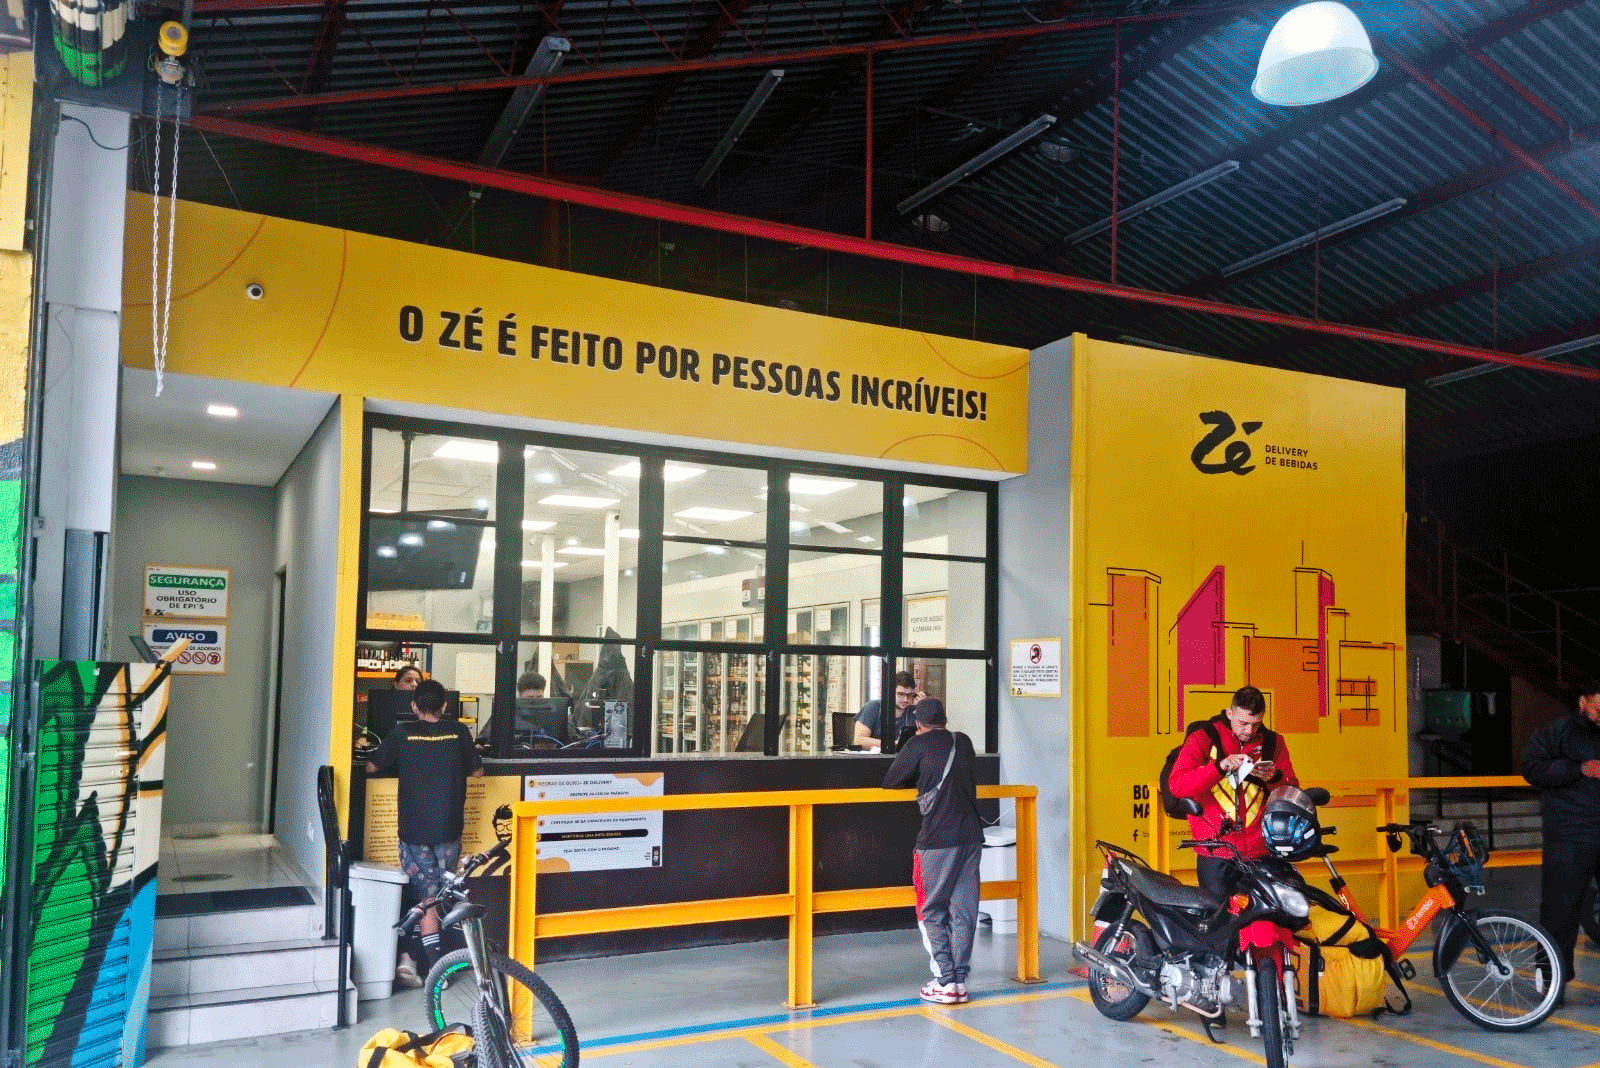
Taking notes and validating situations based on the 4 pillars of acting: Visibility, Sizing, Cost and Acquisition /Retention.
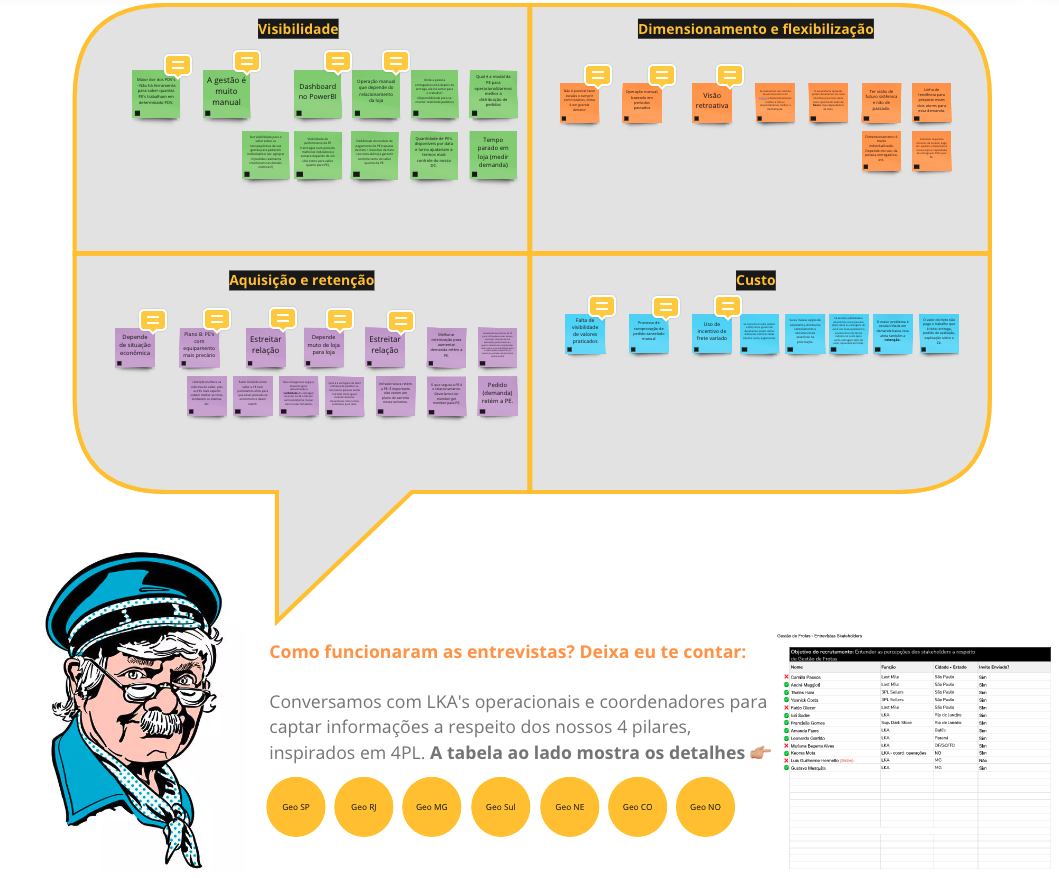
Stakeholders interviews
Following the plan on validate the 4 pillars of acting, we made a round of conversation with Local Key Accounts (leadership and senior levels) and Last Mile Supervisors. Those interviews generated a full list of inputs to move forward onto the research with Couriers and Sellers.
Quantitative interviews
We published a research for the Couriers and Sellers, via inbox and WhatsApp. With data from both sides, we could deliver insights based on statistics.
Acquisition and Retention (%)
Visibility (%)
Sizing and flexibility (%)
Cost (%)
Converging
Process
Generate Inputs
• Cross-data
• Opportunities
• Objectives
• Opportunity solution tree
Define Value Proposition
• Who and Why
• Mission
• Problem Statement
• Stakeholder alignment
Ideate
• 4 pillars overview
• Assemble target
• Fishbone method
• Voting on outcomes
Roadmap Delivery
• Classifying opportunities
• Fleet Management Matrix
• Effort x Value scoring
• Now / Next / Later roadmap
Converting Statistic Data to Objectives
With a clear view on the ecosystem pains, we could separate the subjects in four common objectives, sorted by relevance in their own context.
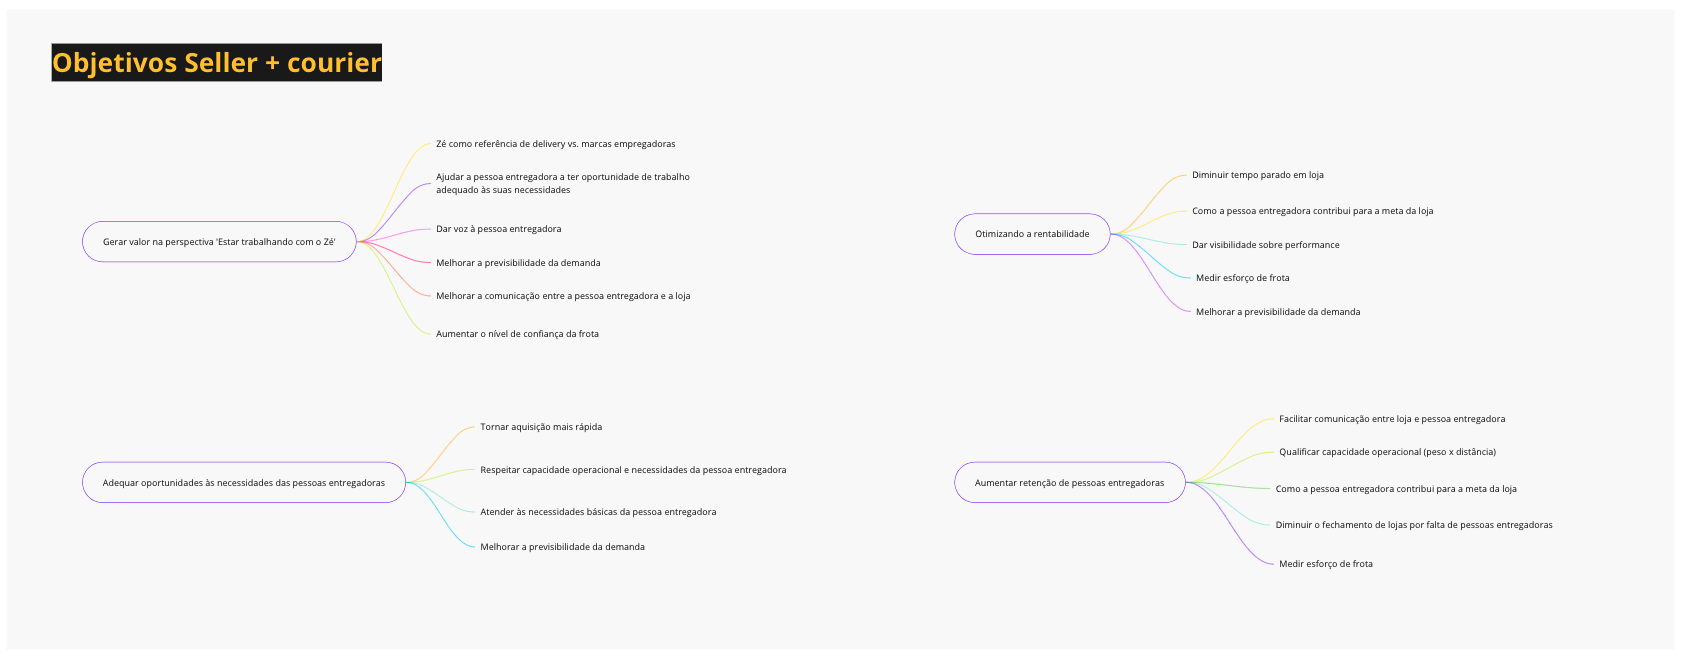
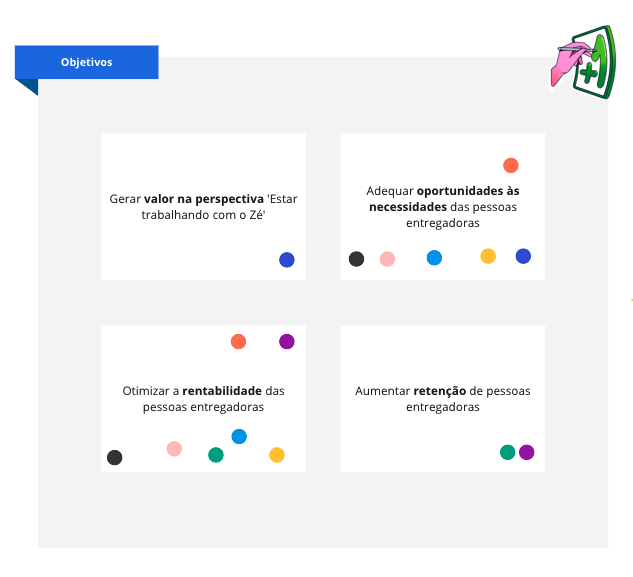
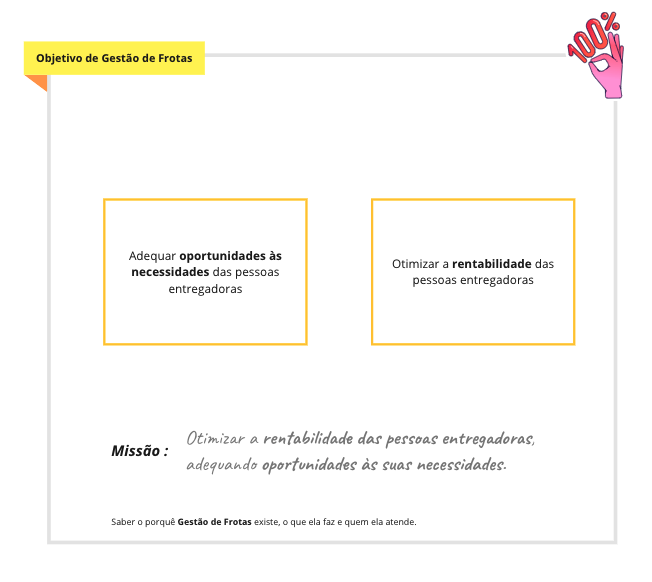
To define our mission, we invited stakeholders and different teams to set up our problem statement.
Time to ideate! There is no right or wrong, it's time to bring a lot of ideas!
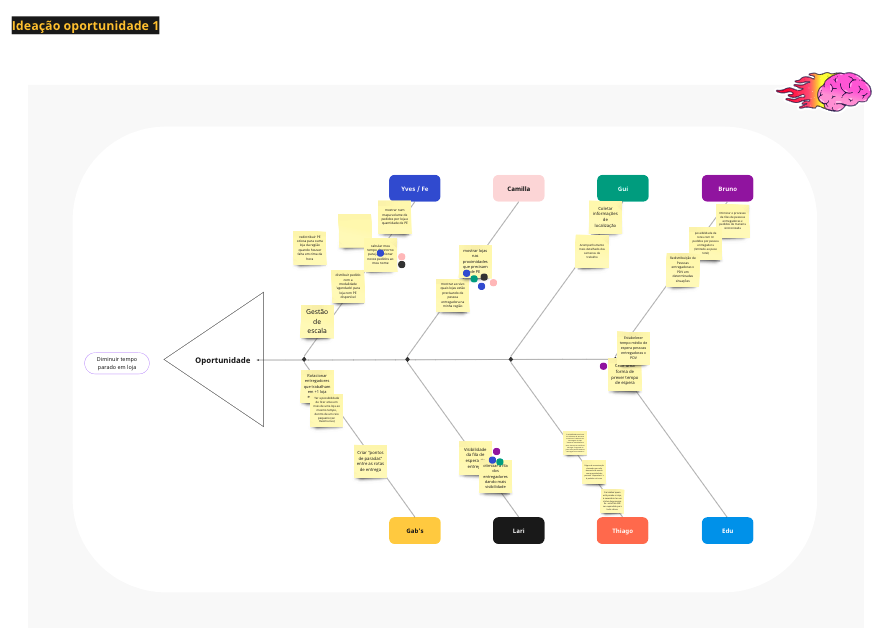
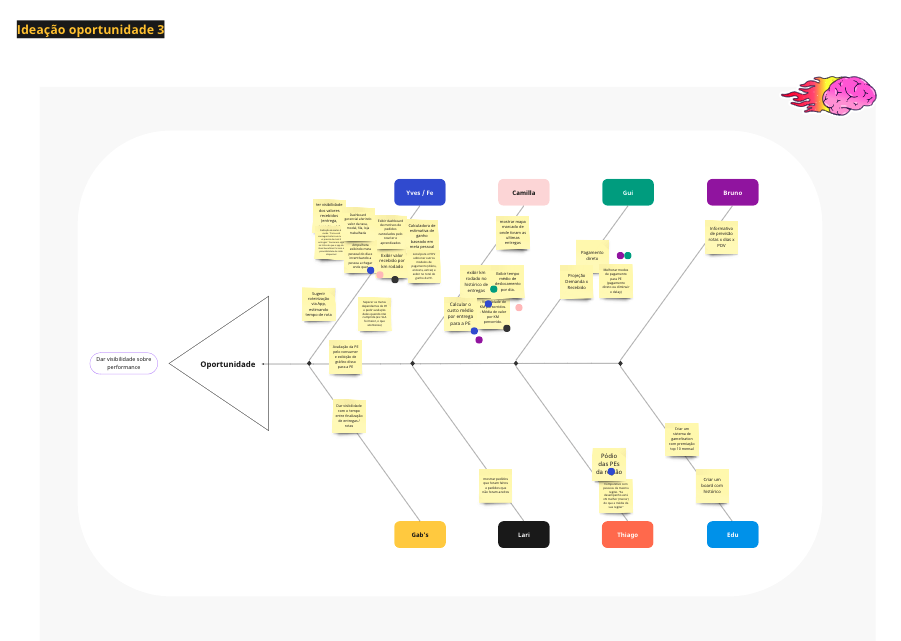
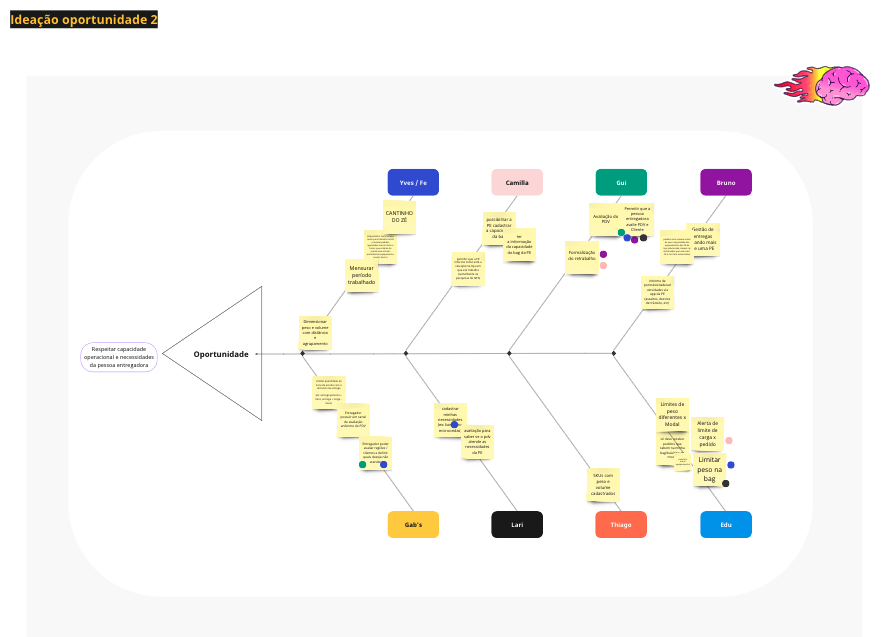
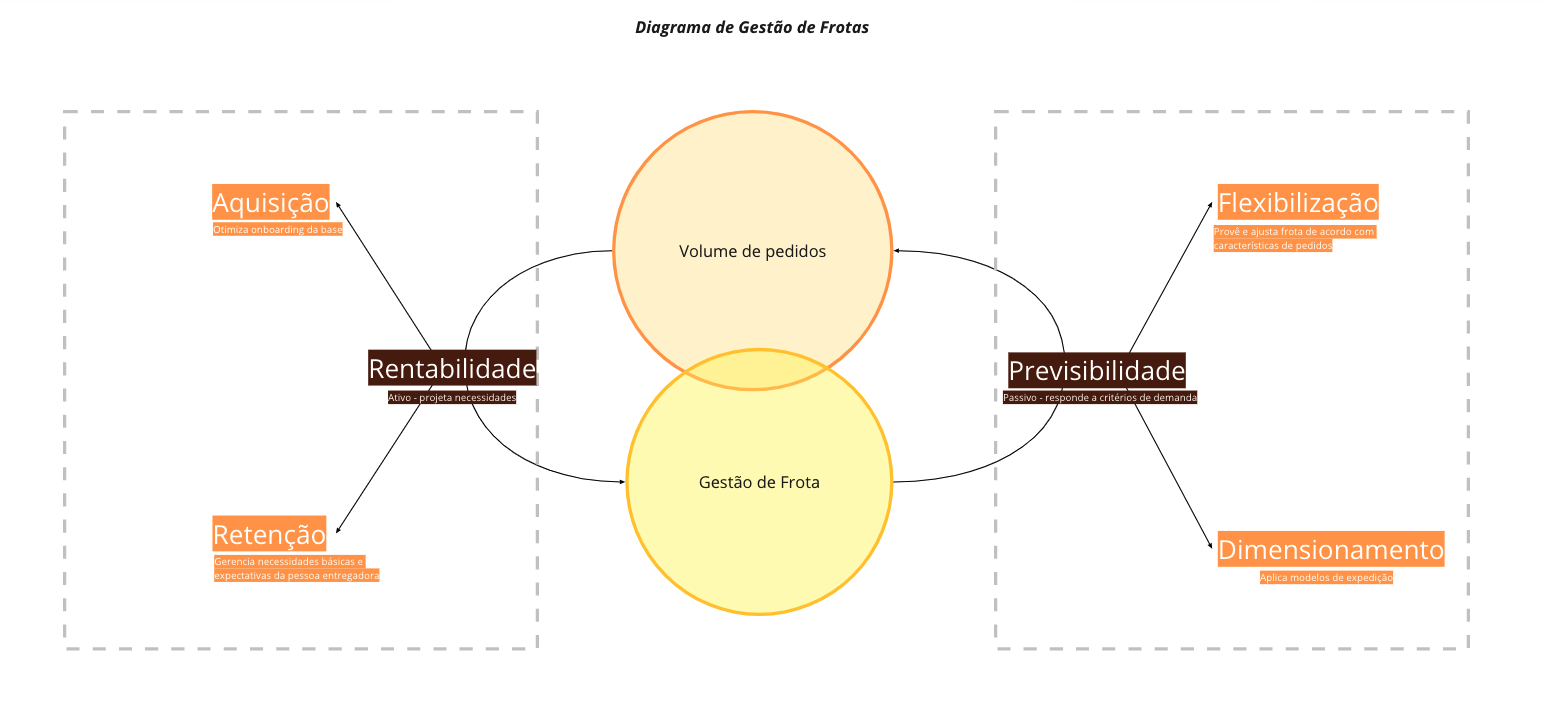
X-Ray of our ecosystem, draw in a form of diagram, which relay impacts and give a clear sight where / when we want to outcome with results.
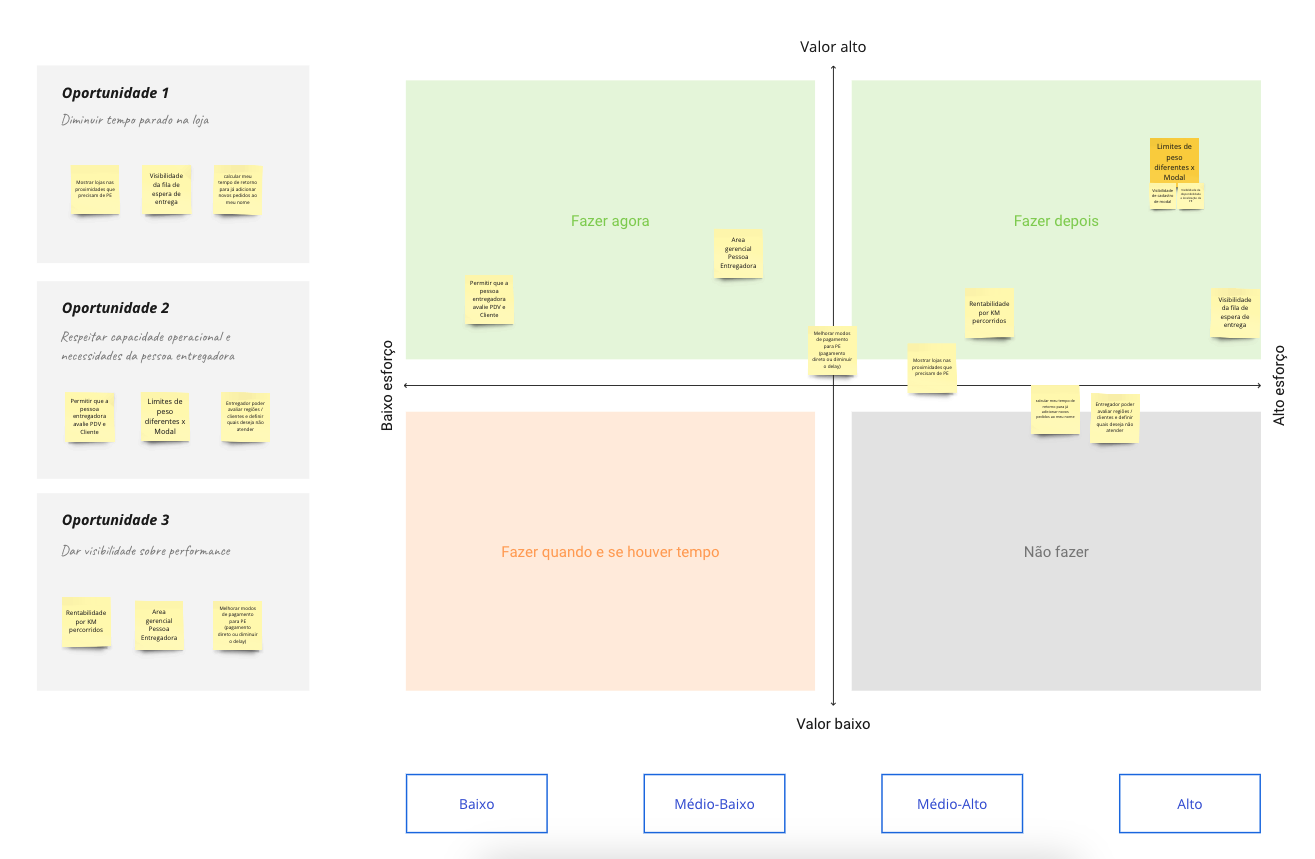
We're getting there - prioritizing activities based on Effort x Value dynamic, with the engineering team and product managers